July 28, 2021 | AI and NLP, Star Ratings, Year Round Prospective HEDIS®
Catch a Falling Star
From Astrata’s Data Science Desk
Many Health Plans could Lose Star Ratings Soon Due to a New Cutoff-Point Calculation Method. Find out if your Plan is at Risk, and How you Can Adapt.
Starting with data from the measurement year 2022, a proposed change to the way CMS calculates Medicare Advantage Star Rating cutoff thresholds will raise the bar on what it takes to keep or gain a Star. CMS estimates these changes will reduce Medicare Trust Fund spending by $4.1 billion through 2024-2030.

Rebecca Jacobson, MD, MS, FACMI
Co-Founder, CEO, and President
Where will those Medicare Trust Fund savings come from? Based on our analysis, they are most likely to come at the expense of health plans with measure ratings at or near the lower bound of current cutpoints. By 2024, many 3 and 4-star plans that merely maintain their current rates risk losing one full Star for measures whose cutoff points are affected by the revised calculations.
For many plans, this means business-as-usual isn’t an option. The institutional muscle movements that will be required to maintain your existing Stars also have the potential to transform your Quality operation into a proactive force for improving population health and to boost your rates high enough to qualify for Quality Bonus Payments. You can start making those moves now, by developing a strategy for using unstructured data and shifting your teams and systems to year-round prospective HEDIS®. Want help? Let us know – we’re already on it.
Overall Star ratings are a weighted average of individual measures, so losing a star for any measure could potentially result in a decline in overall ratings. Astrata can help 4-Star and higher plans monitor and optimize their rates to maintain the Stars they have, continue qualifying for Quality Bonus Payments, or reach for 5-Star status.
Read on for a deeper dive into the math behind this change, our assessment of how it will affect plans at every star level, and our recommendations for maintaining your Stars going forward.
Deep Dive: Tukey Outlier Deletion – Raising the Bar Across the Board
Starting in measurement year 2022, CMS plans to begin using a standard statistical method called Tukey Outlier Deletion to remove outlier data from cutoff point calculations.
CMS currently uses an agglomerative hierarchical clustering algorithm to calculate rates and cutoff points: that’s statistics-speak for the bottom-up method CMS uses to translate 46 individual measure ratings in 9 domains to an overall score of 1 to 5 Stars. Currently, this process uses all scores from all contracts, regardless of how high or low those scores are. Starting in 2022, CMS plans to use the Tukey outlier deletion method to remove outlier data from the calculation process. High and low measure scores that fall outside a standard range will no longer be included in the cutoff-point computation.
To avoid dramatic shifts in the cutpoint ranges for each star level, CMS has also proposed applying guardrails such that the lower and upper bounds of cutpoints cannot move more than 5% in either direction from previous years’ cutpoints regardless of the clustering outcome. But even with the guardrails, this change could still have a big impact, especially on plans with scores at the lower bound of the current cutoff thresholds. According to the Federal Register, “If Tukey outer fence outlier deletion and a 5 percent cumulative guardrail had been implemented for the 2018 Star Ratings, 2 percent of MA–PD contracts would have seen their Star Rating increase by half a star and 16 percent would have decreased by half a star.”
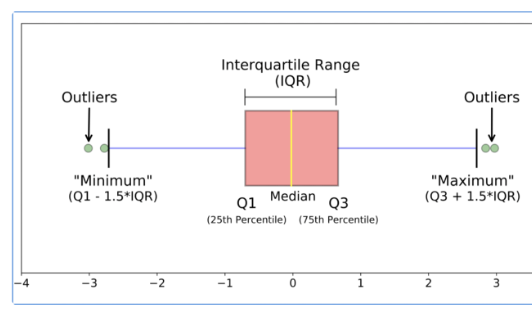
Figure 1: Tukey’s outlier detection method
Figure 1 shows a traditional box plot with data points that would be considered outliers according to Tukey’s method with 5% guardrails. Note that according to CMS, any data point that does not fall within the range of Q1-3.0*IQR — Q3+3.0*IQR is considered an outlier.
We analyzed data available in CMS’ 2021 Star Ratings Data table to understand how the Tukey method will affect Star Rating cutoff points overall. (See our full methodology, including a link to the datasets we used, at the end of this article). We found that most measures included in Star Rating calculations have outliers at the lower end, below the Q1-3.0*IQR threshold. To model the likely impact of using the Tukey method, we replicated the clustering process CMS uses to compute cutoff points, excluding outliers from the calculation process, for several measures.
Because there are more low-scoring plans overall, cutoff thresholds become more competitive and compact for lower-scoring plans, raising the bar for the scores required to reach a given cutoff point. In other words, to achieve the same Star ratings they have right now, many plans will need higher scores than in previous years – in some cases, much higher scores. Plans that take no action to get their overall scores up to the new thresholds could likely see their Stars fall in 2024.
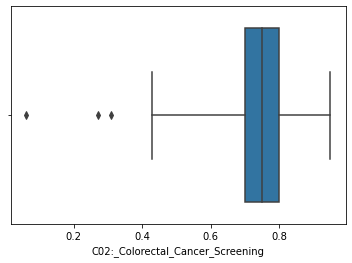
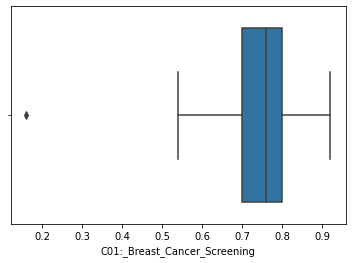
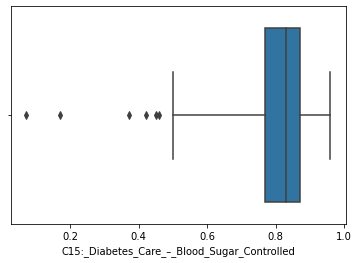
Figure 2: Identified Outliers for COL, CDC-HbA1c Control, and BCS
Modeling Measure Cutpoints with Tukey Outlier Deletion
The table below compares current cutpoints for the most recent year with the new cutpoint ranges (with outliers deleted) for the Comprehensive Diabetes Care – Hemoglobin A1c Testing (CDC HbA1c) sub-measure.
| Comprehensive Diabetes Care – Hemoglobin A1c Testing (CDC-HbA1c) | ||
| Current Cutpoints (%) | Cutpoints after Tukey Outlier Removal (%) | Star Rating |
| Up to 37 | Up to 39 | 1 |
| >=37 to < 61 | >=39 to < 64 | 2 |
| >=61 to < 72 | >=64 to < 76 | 3 |
| >=72 to < 85 | >=76 to < 87 | 4 |
| 85 or greater | 87 or greater | 5 |
Figure 3: New star-rating cutpoint ranges vs cutpoints post Tukey’s deletion for CDC-HbA1c, with 5% guardrails
These data show that, for the CDC HbA1c sub-measure, the cutpoint threshold for a 1-star rating will move from 37% to 39%. Plans that currently have a 3-star rating at the lower end of the cutpoint threshold – (61-63) – could lose a star under this system, dropping to a 2-star rating. Similarly, plans that have scores in the lower end of the 4-star range (72-75) are at risk of falling to 3 stars.
We’ve observed similar trends for other measures, with plans at the lower end of the range having a greater risk of losing a Star with the Tukey outlier adjustment. The tables below show our modeled cutpoints for Colorectal Cancer Screening (COL), Breast Cancer Screening (BCS), and Medication Adherence for Hypertension (MED-RAS).
| Colorectal Cancer Screening (COL) | ||
| Current Cutpoints (%) | Cutpoints after Tukey Outlier Removal (%) | Star Rating |
| Up to 43 | Up to 45 | 1 |
| >=43 to < 62 | >=45 to < 65 | 2 |
| >=62 to < 73 | >=65 to < 77 | 3 |
| >=73 to < 80 | >=77 to < 81 | 4 |
| 80 or greater | 81 or greater | 5 |
Figure 4: New star-rating cutpoint ranges vs cutpoints post Tukey’s deletion for COL, with 5% guardrails
| Breast Cancer Screening (BCS) | ||
| Current Cutpoints (%) | Cutpoints after Tukey Outlier Removal (%) | Star Rating |
| Up to 50 | Up to 53 | 1 |
| >=50 to < 66 | >=53 to < 69 | 2 |
| >=66 to < 76 | >=69 to < 76 | 3 |
| >=76 to < 83 | >=76 to < 83 | 4 |
| 83 or greater | 83 or greater | 5 |
Figure 5: New star-rating cutpoint ranges vs cutpoints post Tukey’s deletion for BCS, with 5% guardrails
| MED-RAS | ||
| Current Cutpoints (%) | Cutpoints after Tukey Outlier Removal (%) | Star Rating |
| Up to 80 | Up to 80 | 1 |
| >=80 to < 84 | >=80 to < 84 | 2 |
| >=84 to < 87 | >=84 to < 87 | 3 |
| >=87 to < 89 | >=87 to < 89 | 4 |
| 89 or greater | 89 or greater | 5 |
Figure 6: New star-rating cutpoint ranges vs cutpoints post Tukey’s deletion for MED-RAS, with 5% guardrails. There is no change to cutpoints for this measure, which should be typical of measures with high starting cutpoint values.
As the CMS Medicare Advantage Star Rating program evolves, many plans have yet to achieve at least 4 Star status and are leaving Medicare revenue on the table. With the effects of these upcoming changes, plans that have already achieved 4 Star and higher status will need to increase their focus on CAHPS measures, and also maintain or improve their performance on non-CAHPS Star measures. Plans that haven’t already done so should take immediate steps to adopt data-driven, calculated, year-round approaches to non-CAHPS-based measures that qualify for these cut-point methodological shifts.
Astrata’s NLP-based solutions and data engineering methods can quite literally come to the rescue here. We work with our clients to build customized strategies for everything from gathering and processing the right data for real-time analysis to adopting year-round HEDIS workflows, to monitoring and optimizing measure rates. Want to learn more? Get in touch.
Methodology
We performed our analysis on publicly-available data from CMS, specifically, the OCT 08 2020 – 2021 Star Ratings Data Table:
https://www.cms.gov/Medicare/Prescription-Drug-Coverage/PrescriptionDrugCovGenIn/PerformanceData
We used the following method to compute cutoff point ranges:
- Get measure scores and drop all plans that do not have data reported for that measure
- Compute Q1, Q3 and IQR (Q3-Q1)
- Identify outliers using < (Q1 – 3.0 * IQR) and > (Q3 + 3.0 * IQR)
- Drop identified outliers
- For the remaining data, perform Mean resampling and Agglomerative Hierarchical Clustering using “Euclidean distance” and “Ward method” for linkage
- Obtain cluster labels and derive cutoff point ranges using labels and scores
- Apply proposed guardrails to ensure cutpoints do not exceed the absolute 5% limit
References
https://bluepeakadvisors.com/proposed-changes-to-ma-and-part-d-prescription-drug-program-qrs/